Venue Legacies: Historical Data Patterns Shaping Pre-Match Probabilities for Recurring Stadiums and Courts
Written by Alex Beck · Jun 26, 2026
Venue Legacies: Historical Data Patterns Shaping Pre-Match Probabilities for Recurring Stadiums and Courts
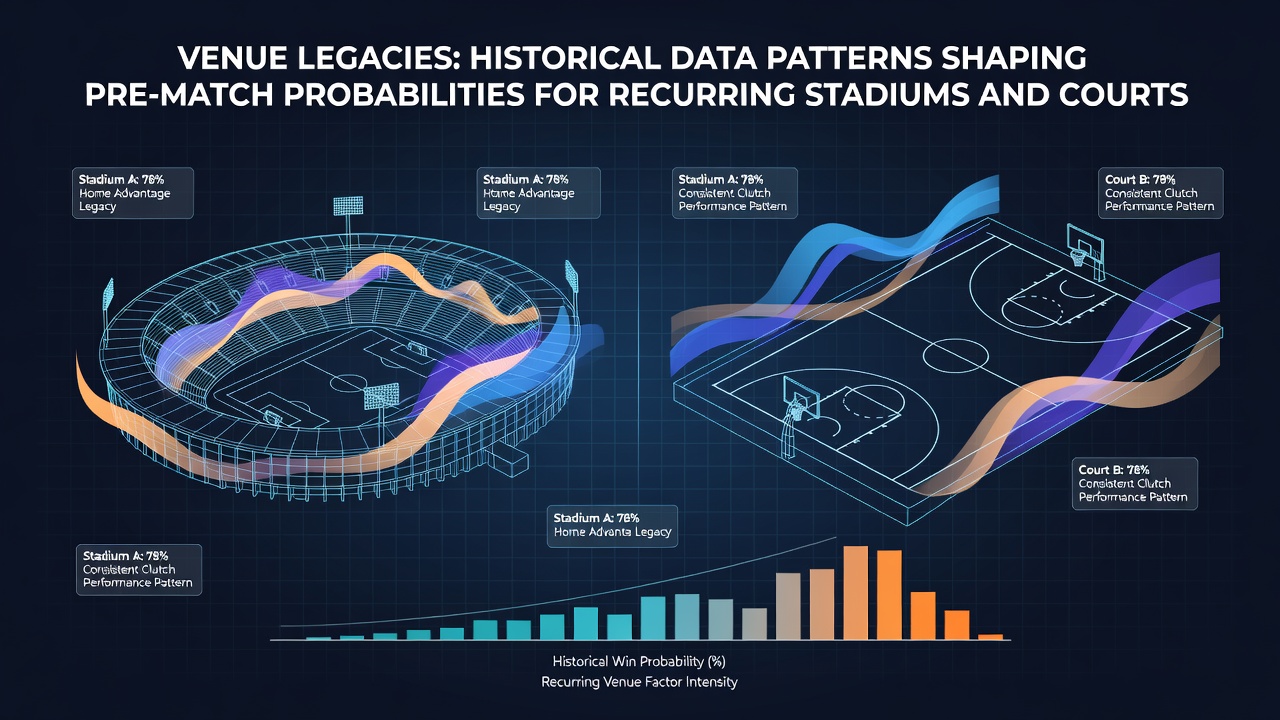
Observers note that recurring stadiums and courts carry measurable legacies built from decades of match outcomes, and these patterns feed directly into pre-match probability models used across multiple sports. Data compiled from repeated fixtures at the same locations reveals consistent advantages or disadvantages that teams and players encounter year after year. Researchers track variables such as pitch dimensions, altitude, surface wear patterns, and crowd proximity, then feed those metrics into algorithms that adjust baseline win probabilities before any lineup is announced. Football stadiums provide some of the clearest examples. Grounds like Old Trafford or the Allianz Arena accumulate statistical profiles showing elevated scoring rates for home sides during evening fixtures, while away teams record lower conversion percentages on shots taken from specific angles. Analysts compare these figures against neutral-venue benchmarks to isolate the venue effect, and the resulting adjustments appear in probability tables released weeks ahead of scheduled matches. In June 2026, several European leagues will complete their seasons on pitches that have already hosted more than 40 competitive fixtures since the previous summer, giving statisticians fresh datasets to refine those same legacy calculations.Tennis Court Surfaces and Player-Specific Records
Tennis venues accumulate even more granular histories because the same athletes return to identical courts multiple times each season. Clay courts in Madrid and Rome show extended rally lengths in historical match logs, whereas grass at Wimbledon produces shorter points and higher serve percentages for players with strong net approaches. Tournament organizers publish surface-speed indices derived from ball-tracking data collected across previous editions, and these indices shift pre-match probabilities for individual matchups by measurable margins. Observers note that a player with a 78 percent win rate on a particular hard-court arena over five seasons enters the next event with an adjusted likelihood that accounts for that exact surface rather than a generic hard-court average.
Cricket Grounds and Environmental Variables
Cricket stadiums add another layer through weather and pitch deterioration records. Venues such as the Melbourne Cricket Ground hold multi-year archives of first-innings totals under different cloud covers and temperatures, while smaller grounds in India display sharper declines in scoring rates after the 35th over when the surface begins to crack. Modelers incorporate these longitudinal datasets to adjust projected run rates before teh toss occurs. Because many international sides visit the same locations on rotating schedules, the accumulated evidence grows denser each cycle and allows more precise calibration of opening probabilities.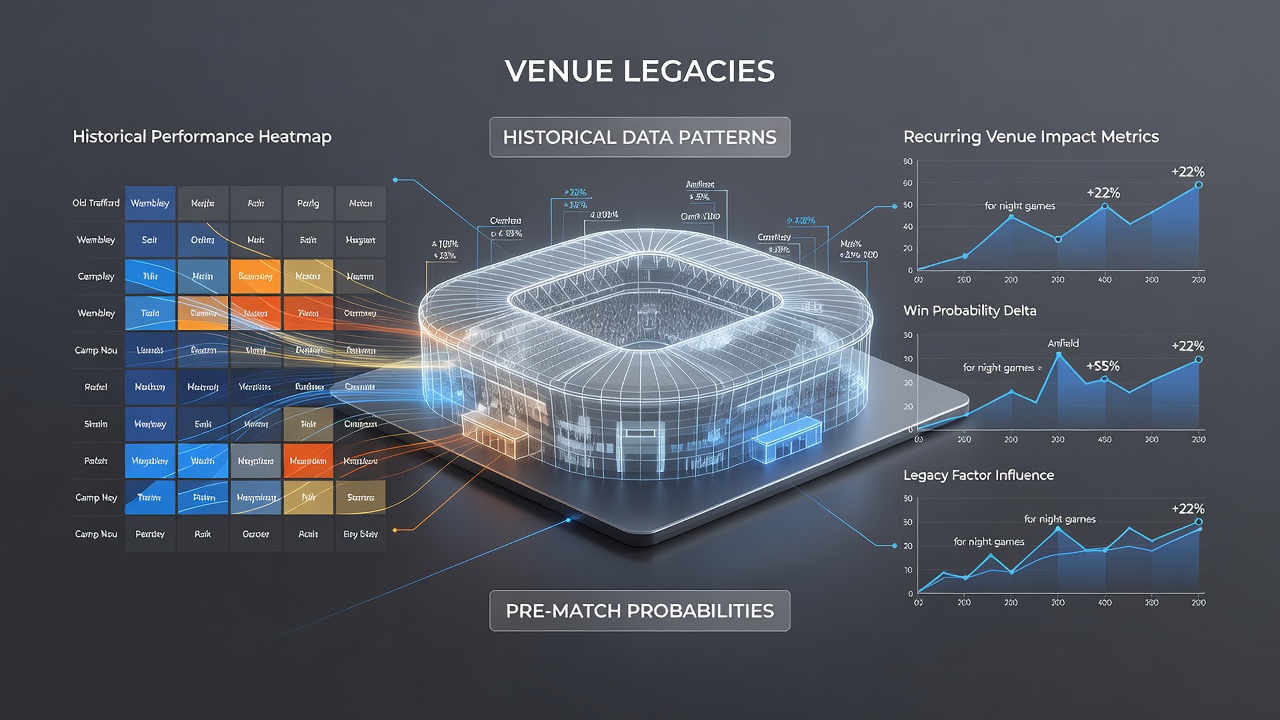
Integration into Pre-Match Models
Probability engines combine venue-specific legacy data with current form by applying weighted historical filters. A side that wins 62 percent of its matches at a particular stadium over 12 seasons receives an uplift in the baseline calculation, whereas a player who drops serve 18 percent more often on a given court surface sees that tendency subtracted from expected hold rates. These adjustments occur before betting markets open and before lineups are finalized, which means the initial probability distribution already embeds the recurring venue effect. Studies published by the National Collegiate Athletic Association demonstrate similar patterns in college basketball arenas, where home teams maintain elevated three-point percentages on courts they occupy every season.
Case Examples Across Regions
Australian researchers have documented how rectangular stadiums in Sydney and Brisbane produce distinct tackle-success rates compared with oval configurations in Perth, and those differences feed into rugby league probability models used by local analysts. European football federations maintain comparable databases that isolate the impact of travel distance combined with venue familiarity. The result is a layered probability surface rather than a single number; each recurring stadium or court contributes its own historical signature that shifts the pre-match outlook in quantifiable ways. Data from Sport Australia reports confirm that such venue adjustments improve forecast accuracy by several percentage points when tested against out-of-sample results.Conclusion
Venue legacies therefore function as stable inputs rather than anecdotal background. Because the same locations host repeated events, statisticians accumulate sufficient observations to separate venue effects from team strength or player form. Those separated effects then revise pre-match probabilities before the first whistle or serve, creating distributions that reflect both contemporary conditions and the accumulated record of each specific stadium or court. As datasets expand through the 2026 season and beyond, the precision of these adjustments continues to increase across football, tennis, cricket, and other sports that return regularly to the same physical sites.