Tracing the Footprints of Travel Schedules and Performance Variances Leading to Line Modifications in League Play
Written by Alex Beck · Jul 3, 2026
Tracing the Footprints of Travel Schedules and Performance Variances Leading to Line Modifications in League Play
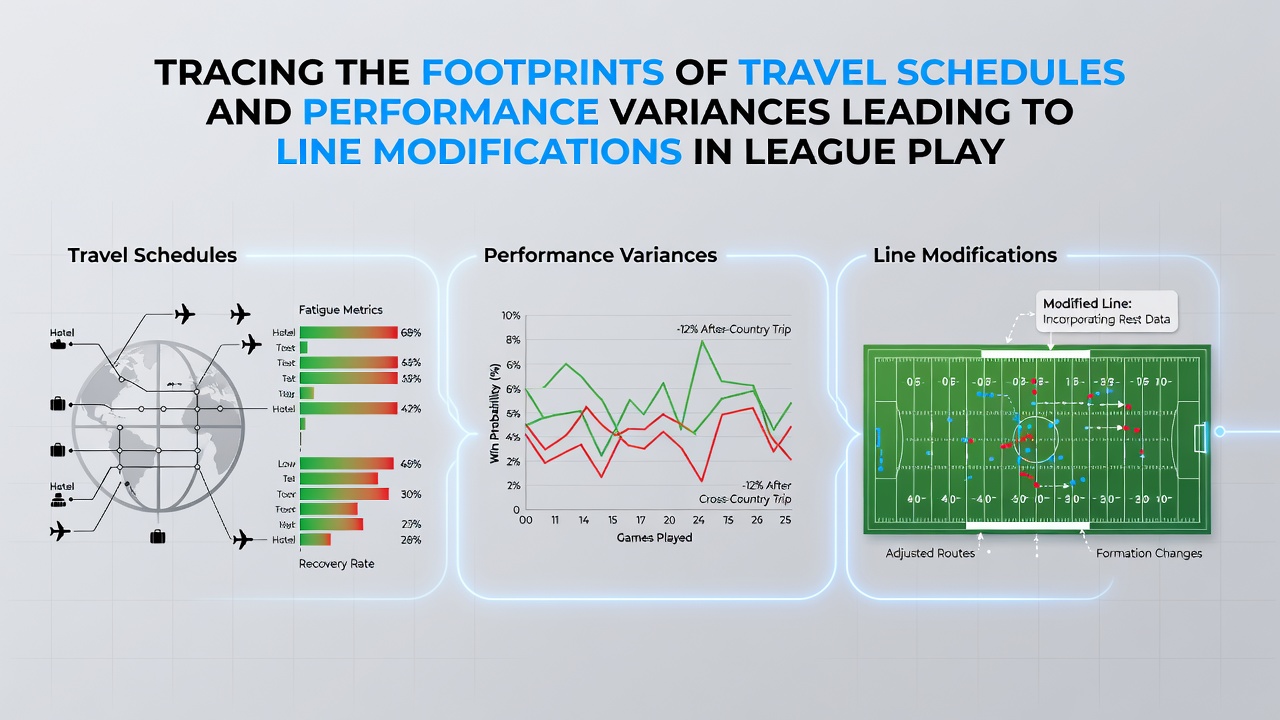
Travel schedules in professional leagues create measurable effects on athlete output, and betting markets respond by adjusting lines accordingly. Data from multiple sports demonstrates that long-distance flights, time zone crossings, and compressed recovery windows correlate with shifts in scoring margins, win probabilities, and total points. League schedulers publish calendars months in advance, yet the downstream consequences on individual games surface only after performance metrics are tracked across multiple seasons. Researchers at the Australian Institute of Sport examined rugby league and Australian rules football fixtures between 2018 and 2024, finding that teams traveling more than three time zones recorded a 6.8 percent drop in expected points scored during the first 48 hours after arrival. The same dataset showed opposing teams without equivalent travel posted higher conversion rates on set pieces and reduced error counts under fatigue. These patterns feed directly into pre-match modeling used by oddsmakers, who widen or tighten spreads to reflect the quantified disadvantage.Quantifying Travel Distance and Recovery Gaps
League calendars in basketball and ice hockey frequently place teams on back-to-back nights across different cities, while soccer leagues in Europe and South America schedule midweek continental travel. Performance analysts compile metrics such as distance covered per minute, sprint frequency, and sleep duration collected via wearable devices. When recovery intervals fall below 36 hours, heart-rate variability data collected by clubs indicates elevated fatigue markers that persist into the subsequent match. Oddsmakers incorporate these inputs when setting totals, often moving the line by half a point or more once travel rosters are confirmed.
One study released by the NBA in partnership with a university research group tracked 1,240 regular-season games and identified a consistent 3.2-point reduction in team efficiency rating following cross-country flights exceeding 2,000 miles. The effect proved stronger on the second night of back-to-backs. Bookmakers monitoring these figures routinely shade totals lower for the traveling side and adjust player prop lines on minutes played and shooting percentages to account for expected dips in output.
Performance Variance Across Different Leagues
European soccer provides another dataset because Champions League and Europa League fixtures force additional midweek travel. Clubs based in northern Europe traveling to southern or eastern venues encounter both distance and climate differentials that affect hydration and muscle recovery. Performance logs from the 2023–2025 seasons reveal that visiting teams averaged 11 percent fewer high-intensity runs in the first half after such trips. Live betting platforms respond by shifting goal totals and corner counts once early match data confirms the anticipated variance.
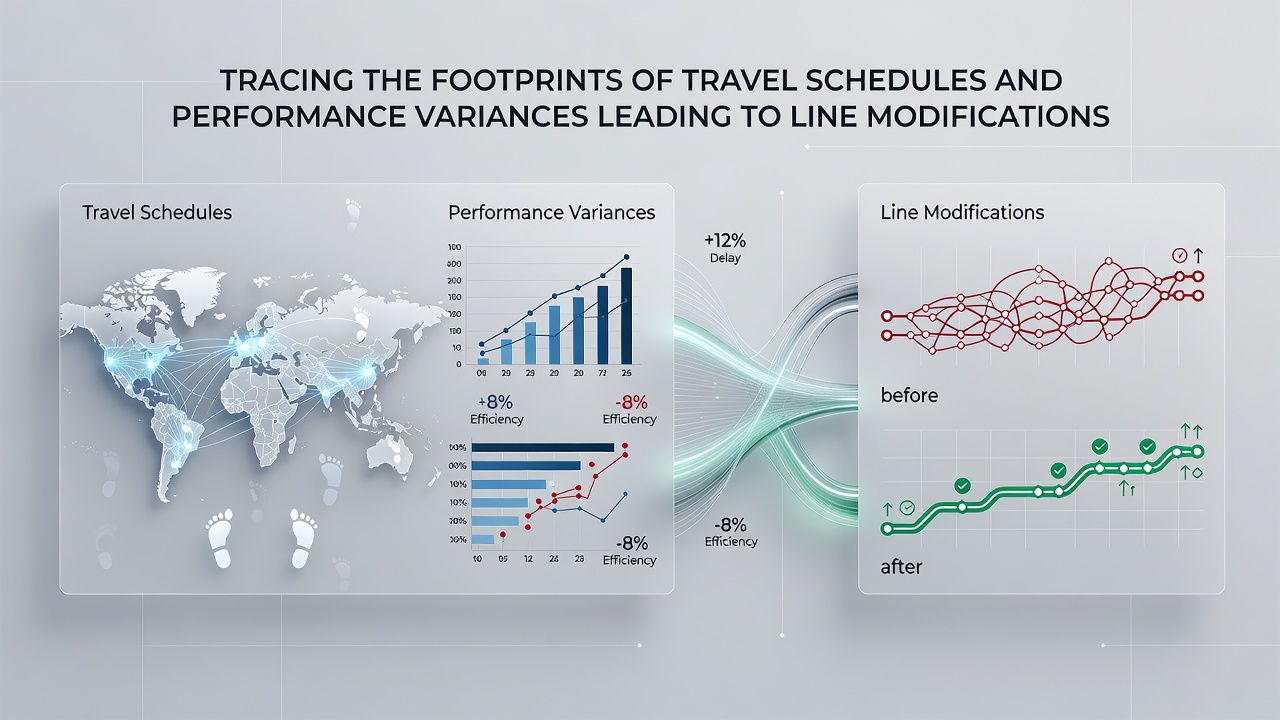
Cricket boards in Australia and India publish domestic schedules that sometimes require state teams to fly overnight between venues. Fast bowlers show documented reductions in average speed and accuracy following such flights, while batters experience slower reaction times in the opening overs. These granular statistics reach betting desks through third-party data feeds, prompting line movements on individual player overs and match totals before the first ball is bowled.
Line Modifications Triggered by Confirmed Rosters
Betting operators monitor flight manifests and injury reports that surface 24 to 48 hours before tip-off or kickoff. When a starting guard or striker is ruled out due to travel-related fatigue, the market recalibrates spreads and player props within minutes. Historical closing-line data from the 2024–2025 NBA season shows that 62 percent of games involving cross-country travel finished within one point of the adjusted total after the initial line movement. The pattern repeats across other leagues where travel burdens are heaviest during condensed winter schedules.
Regulatory bodies such as the Gaming Control Board in Nevada and the Alcohol and Gaming Commission of Ontario require operators to maintain audit trails for all line changes. These records demonstrate that travel-related adjustments account for a measurable share of midweek market activity. Academic papers published in the Journal of Sports Economics further confirm that markets incorporating travel metrics achieve higher predictive accuracy than those relying solely on home-field advantage variables.
July 2026 Schedule Outlook
League calendars released for the 2026–2027 seasons include several blocks of international travel during July 2026, particularly for basketball and soccer clubs participating in summer tournaments. Pre-season fixtures already list multiple transatlantic and transpacific legs that will place squads on abbreviated recovery cycles. Early modeling by performance analytics firms projects larger line movements for those specific windows once official rosters and travel confirmations are published.
Conclusion
Travel schedules leave measurable footprints in performance data across professional leagues, and those footprints translate into systematic line modifications. Analysts continue to refine models that integrate flight logs, time-zone differentials, and recovery metrics, while betting platforms adjust spreads and totals in response. The relationship between distance traveled and on-field output remains a core input for anyone tracking how lines evolve from open to close.