Digital Tools Tracking Athlete Fatigue Patterns Across Overlapping Global Tournaments in Football, Basketball, and Cricket
Written by Alex Wagner · Aug 2, 2026
Digital Tools Tracking Athlete Fatigue Patterns Across Overlapping Global Tournaments in Football, Basketball, and Cricket
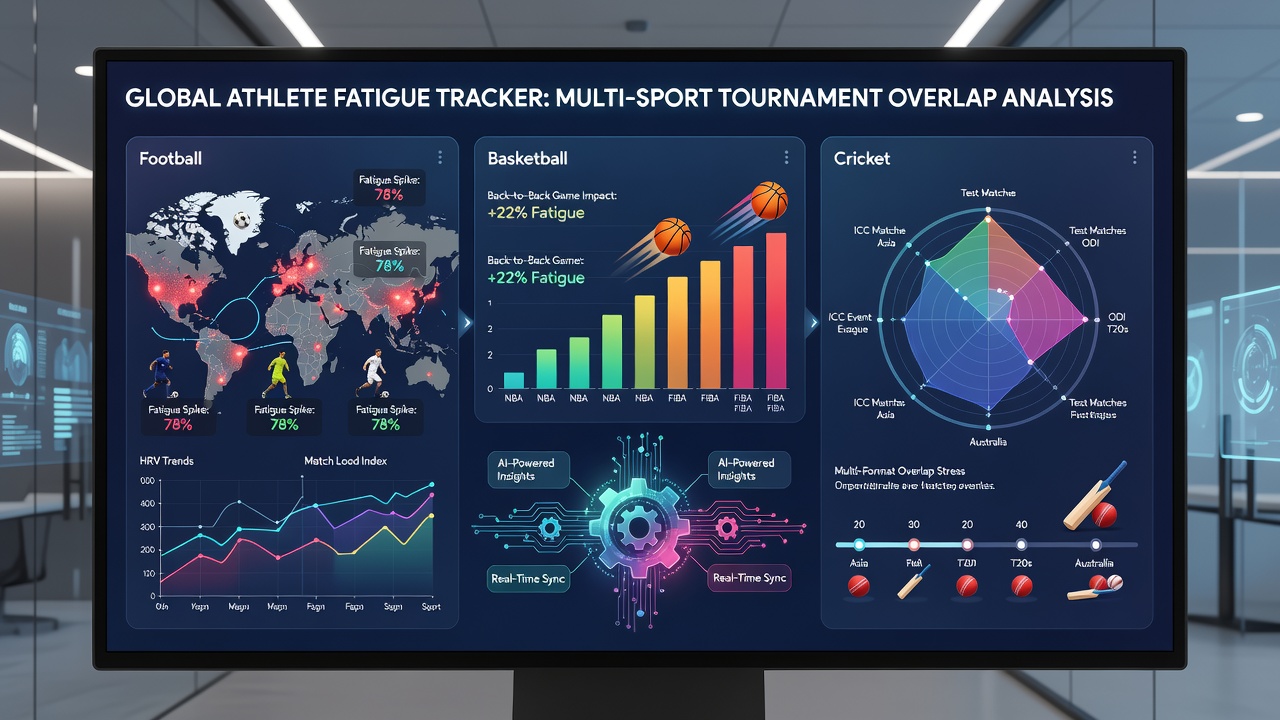
Digital monitoring systems now collect continuous data on player workload through wearable sensors and cloud-based analytics platforms that operate across football, basketball, and cricket schedules. These tools combine GPS tracking, heart-rate variability measurements, and machine-learning models to identify fatigue accumulation when calendars overlap, such as the dense international windows that occur in August 2026 alongside club competitions in multiple continents.
Core Technologies Behind Fatigue Tracking
Researchers at sports-science laboratories equip athletes with devices that record acceleration, deceleration, and neuromuscular response every few seconds during matches and training sessions. The data streams feed into algorithms that calculate acute and chronic workload ratios, allowing teams to flag when an individual player's recovery window falls below recommended thresholds. In football, similar systems monitor total distance covered plus high-intensity efforts, while basketball platforms emphasize vertical jump height and movement efficiency, and cricket tools focus on bowling loads plus batting session durations.
Handling Overlapping Tournament Demands
August 2026 presents a particularly congested period because several major club leagues resume while national teams prepare for upcoming qualifiers and bilateral series. Observers note that football clubs in European and South American leagues share players with basketball programs in summer leagues and cricket franchises in T20 competitions, creating simultaneous demands on the same athletes. Digital platforms integrate fixture lists from governing bodies to predict cumulative stress before an athlete travels between events.
Football Applications
Football analysts use optical tracking combined with accelerometer data to measure repeated sprint efforts and recovery times between high-speed runs. When a player participates in a midweek European match followed by an international friendly the next weekend, the system compares session loads against historical recovery curves derived from thousands of previous data points. Teams receive alerts when an athlete's readiness score drops below established baselines, prompting adjustments to training volume.
Basketball Applications
Basketball programs deploy similar sensor arrays that capture court movements and jump loads during back-to-back games common in August tournaments. The software correlates sleep data from wearable rings with on-court metrics to detect early signs of neuromuscular fatigue. Studies conducted at university performance centers show that players who exceed individualized load thresholds experience measurable declines in shooting accuracy and defensive reaction times within subsequent matches.
Cricket Applications
Cricket boards employ bowling load monitors that count deliveries and classify effort levels while also tracking fielding distances during long-format games. When T20 leagues overlap with national tours, the platforms aggregate data across formats and issue recommendations for rest days or modified bowling spells. Evidence from longitudinal monitoring programs indicates that early intervention reduces incidence of lower-back and shoulder complaints among fast bowlers.
Integration Across Sports and Regions
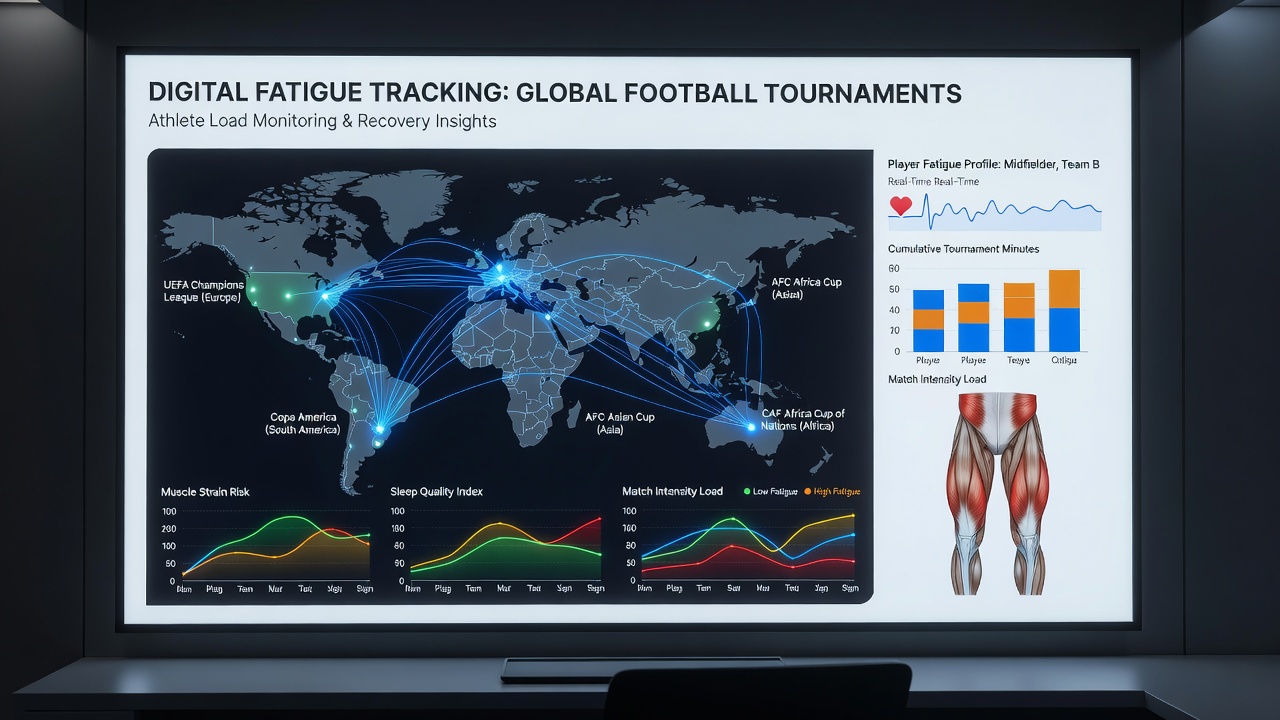
Cross-sport data sharing occurs through standardized protocols developed by international federations, enabling a football player who also competes in basketball or cricket to maintain a unified fatigue profile. Australian and North American research institutions have contributed open-source modules that normalize workload metrics across different playing surfaces and environmental conditions. These shared frameworks help national federations coordinate schedules when athletes move between hemispheres during August windows.
Regulatory bodies such as those overseeing elite sport in Canada and the European Union have begun requiring clubs to document use of validated monitoring systems as part of athlete welfare guidelines. The resulting datasets reveal consistent patterns: athletes who compete in three or more overlapping events within a 30-day span show elevated fatigue markers that persist for up to 10 days after the final fixture.
Case Examples From Recent Seasons
One documented instance involved a multi-format cricketer whose sensor data triggered an alert after consecutive T20 matches followed by a limited-overs international series. Medical staff adjusted his training load and incorporated additional recovery protocols, after which subsequent performance metrics remained stable. Similar interventions appear in basketball programs where players transition from summer league commitments into pre-season preparation for club seasons that begin in autumn.
Football teams have reported comparable outcomes when digital systems flagged elevated fatigue ahead of August international breaks. Data aggregated across multiple leagues indicates that proactive workload management correlates with fewer soft-tissue injuries during the opening weeks of domestic campaigns.
Conclusion
Digital fatigue-tracking tools now form an established part of preparation for athletes who navigate concurrent global tournaments in football, basketball, and cricket. By combining real-time sensor input with historical performance records, these platforms supply objective indicators that support scheduling decisions and recovery planning throughout periods such as August 2026. Continued refinement of cross-sport data standards promises further improvements in how federations and clubs protect participant health amid increasingly dense calendars.