Decoding Venue-Specific Variables in Probability Calculations for Multi-Venue Tournament Formats
Written by Cameron Perry · Jul 19, 2026
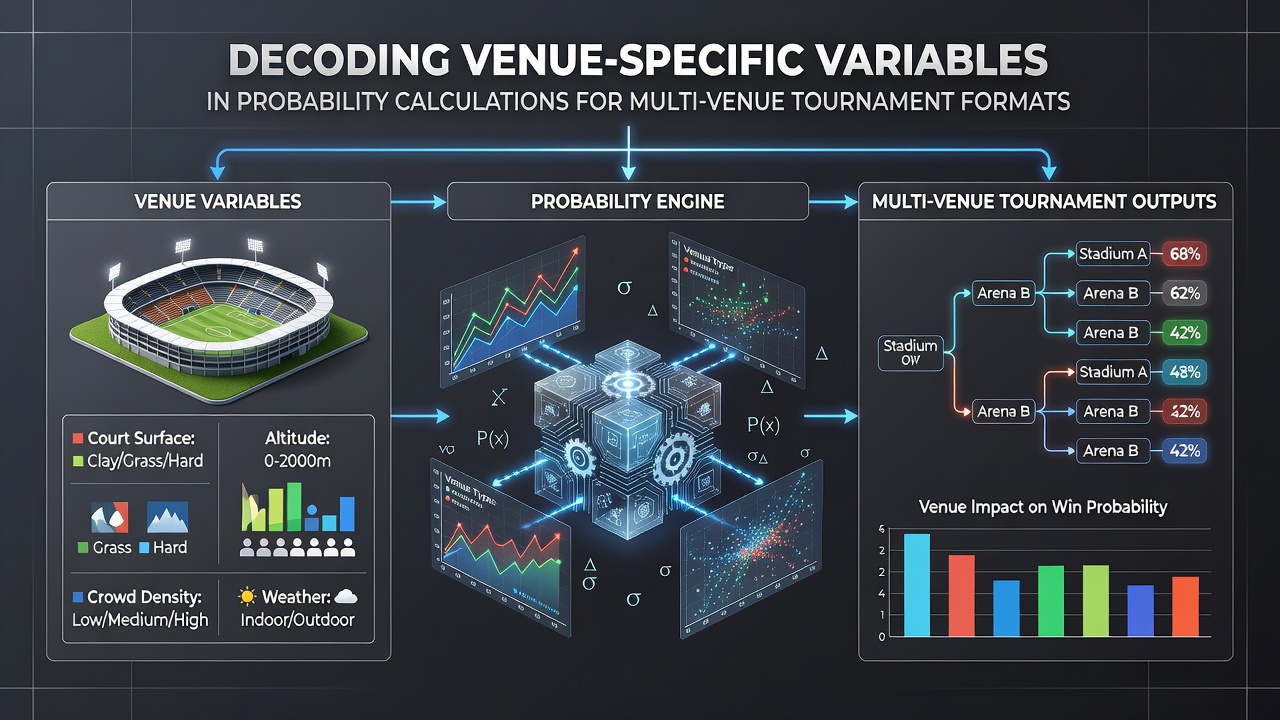
Decoding Venue-Specific Variables in Probability Calculations for Multi-Venue Tournament Formats
Multi-venue tournament formats introduce layers of complexity into probability calculations because each location carries distinct physical and environmental characteristics that shift outcome likelihoods. Organizers schedule events across multiple sites to accommodate larger fields and varied audiences while participants must adapt strategies based on surface type, altitude, climate patterns, and infrastructure differences that directly feed into statistical models.
Core Variables That Alter Probability Inputs
Researchers identify several measurable factors that require explicit adjustment in any probability framework applied to multi-venue events. Surface friction coefficients change ball speed and bounce height in tennis or cricket, whereas elevation affects air density and therefore projectile trajectories in golf or baseball. Temperature and humidity readings recorded at each venue further modify player endurance estimates and equipment performance metrics during extended matches or rounds.
Data collection protocols now incorporate real-time sensor inputs from each site so models can recalibrate expected values before every session. Observers note that these adjustments become especially critical when tournaments span both indoor and outdoor facilities within the same calendar window, because lighting conditions and crowd acoustics add secondary influences on concentration and reaction times.
Integration into Statistical Frameworks
Probability calculations for such tournaments rely on hierarchical Bayesian structures that treat venue as a random effect nested within player or team performance priors. Analysts assign venue-specific coefficients derived from historical match logs, then update posterior distributions after each completed round. This approach allows the model to isolate location-driven variance from intrinsic skill differences and produces more accurate forecasts when the schedule moves to the next host city.
Software platforms used by professional betting operators and academic research groups apply these layered models automatically. They ingest venue metadata alongside live scoring feeds so that implied probabilities refresh continuously throughout the event cycle. In July 2026 several major tennis circuits will again rotate through grass, clay, and hard-court venues within weeks of one another, providing fresh datasets for ongoing model validation.
Practical Examples Across Sports
Take one researcher who examined golf major championships where consecutive rounds occur at courses differing by several hundred meters in elevation and by distinct grass varieties. The study isolated how green speed and wind patterns at each site altered scoring averages by measurable margins, then incorporated those deltas into pre-tournament simulations. Similar patterns appear in cricket test series hosted across continents, where pitch preparation standards vary by national board and directly affect run-rate distributions.
Another documented case involved basketball tournaments that shift between sea-level arenas and high-altitude domes. Researchers discovered that three-point shooting percentages rose measurably at elevation while defensive recovery times lengthened, prompting probability engines to apply separate covariance matrices for each venue cluster. These adjustments propagate through accumulator calculations when bettors combine outcomes from multiple stops on the same circuit.

Data Sources and Regulatory Context
National statistical agencies supply foundational datasets that support venue modeling. Figures from Australian Bureau of Statistics track environmental conditions at major sporting venues while European sports federations publish standardized pitch and court measurement reports. Academic institutions such as the University of Waterloo maintain open repositories of multi-year performance logs that include precise venue coordinates, enabling independent verification of coefficient stability across seasons.
Industry groups including the Sports Betting Integrity Association publish guidelines on transparent data handling for probability calculations, emphasizing audit trails when venue variables are updated mid-tournament. These practices help maintain consistency when operators adjust odds across different regulatory jurisdictions.
Challenges in Real-Time Application
Live updates introduce latency because weather stations and surface sensors transmit at varying intervals. Model maintainers therefore implement smoothing algorithms that blend the most recent venue readings with longer-term climatological averages. When a sudden storm alters court conditions at one stop but not another, the probability engine must isolate that shock and propagate its effects only to matches scheduled at the affected site.
Coordinating these updates across multiple time zones adds another operational layer. Teams responsible for data pipelines often maintain parallel instances of the model, each tuned to the specific venue cluster active on any given day. This architecture prevents cross-contamination of coefficients when simultaneous events occur at distant locations.
Conclusion
Venue-specific variables remain central to accurate probability calculations in any tournament that spans multiple sites. Structured data collection, hierarchical modeling techniques, and continuous calibration together produce forecasts that reflect the distinct conditions at each host location. As more sports adopt distributed formats, the precision of these adjustments continues to shape both analytical outputs and operational decisions across the sector.